Documents
Participation in the SWOT Science Team: Marine Geophysics
PI: David T. Sandwell (Scripps Institution of Oceanography - La Jolla, CA, USA)
1. Introduction & Objectives
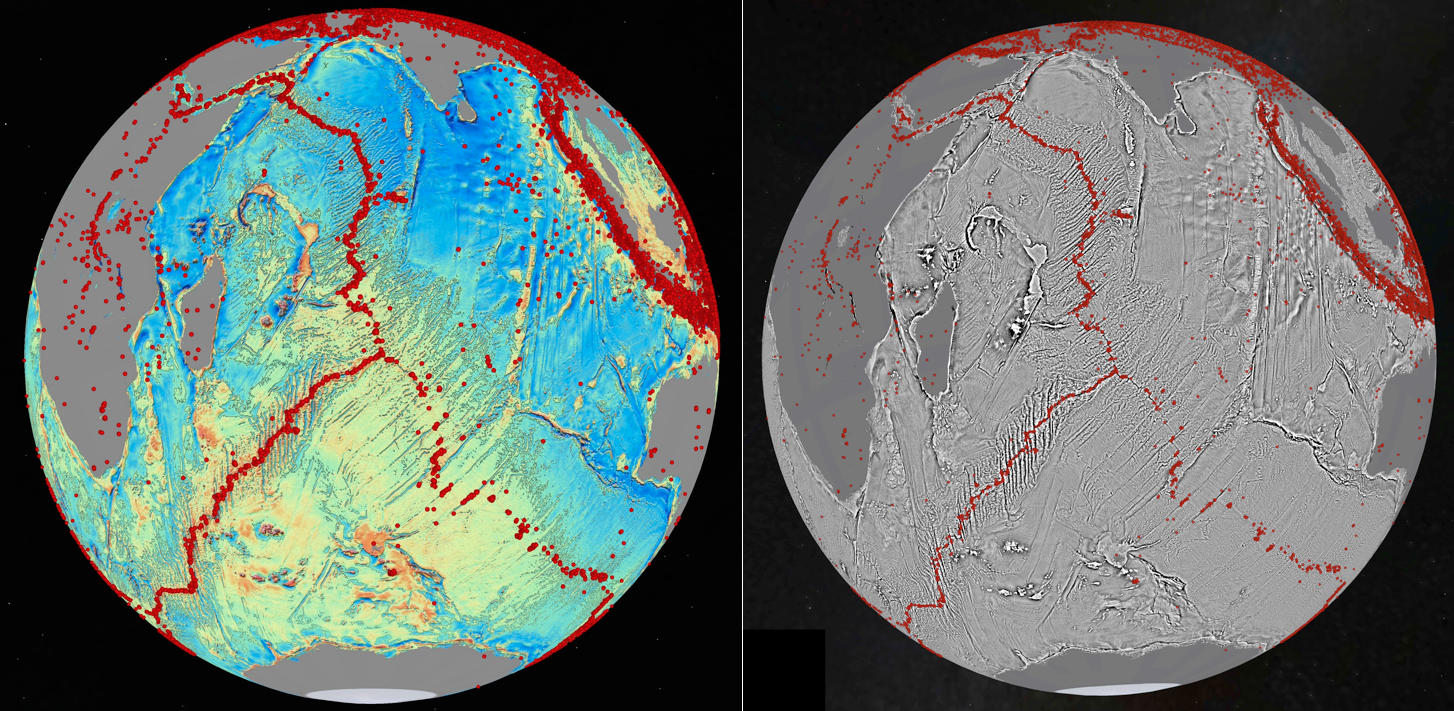
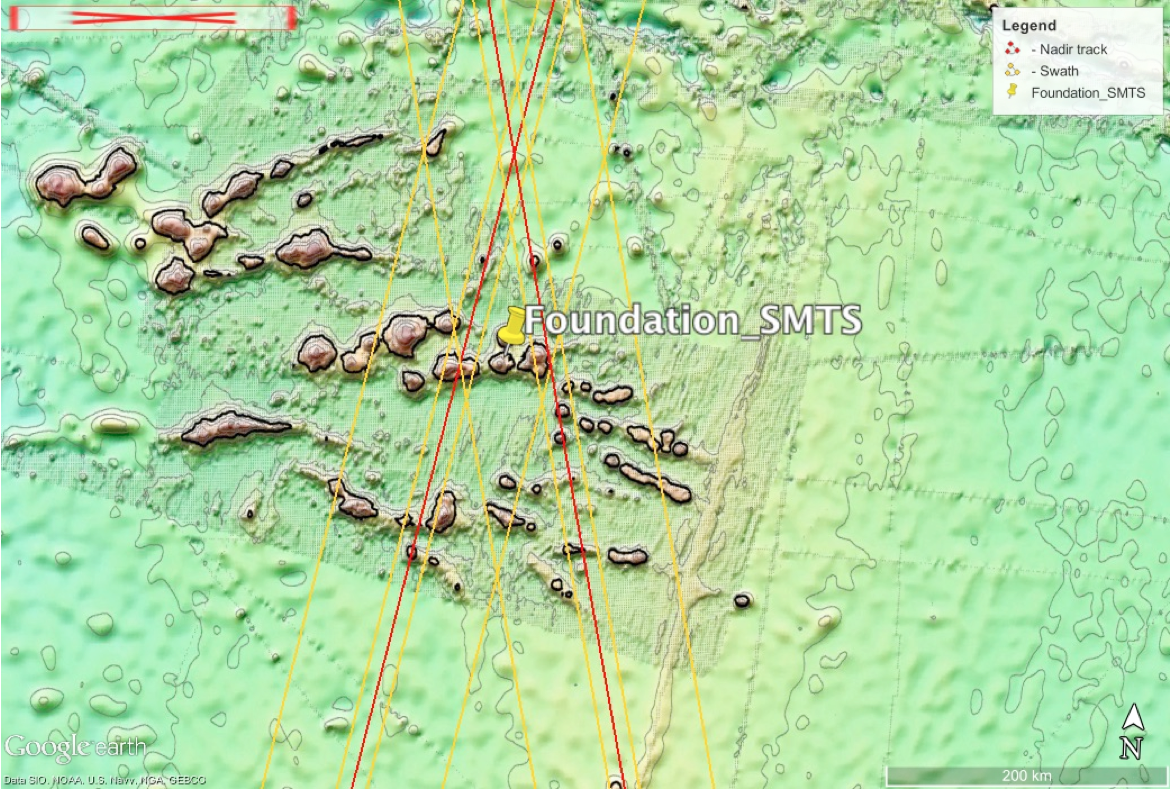
One of the secondary objectives of the SWOT mission is marine geophysics (Figure 1) (Sandwell et al., 2014). The current accuracy of the ocean surface slope derived from traditional altimetry is about 2 microradians at 13 km wavelength, which is equivalent to 2 milligals of accuracy. SWOT, with its smaller footprint and additional cross-track slope measurement, could improve the gravity accuracy by perhaps an order of magnitude and also improve spatial resolution especially on the shallow continental margins. These improvements are critical for a large number of basic science and practical applications, including:
- Understanding the geologic processes responsible for ocean floor features unexplained by simple plate tectonics, such as abyssal hills, seamounts, microplates, and propagating rifts.
- Improving tsunami hazard forecast accuracy by mapping the deep ocean topography that steers tsunami wave energy.
- Determining the effects of bathymetry and seafloor roughness on ocean circulation, mixing, climate, and biological communities, habitats, and mobility.
- Mapping the marine gravity field to improve inertial navigation and provide homogeneous coverage of continental margins.
- Providing bathymetric maps for numerous other practical applications, including reconnaissance for submarine cable and pipeline routes, improving tide models, and assessing potential territorial claims to the seabed under the United Nations Convention on the Law of the Sea. Because ocean bathymetry is a fundamental measurement of our planet, there is a broad spectrum of interest from government, the research community, industry, and the general public (e.g. Google Earth).

Our contribution to the SWOT mission will come in three main areas:
- Waveform Retracking — The first is to continue to analyze existing altimeter waveforms to optimize their range precision and short-wavelength accuracy.
- Mean Sea Surface — The second is the construction of a high-resolution mean sea surface height model in collaboration with scientists at CLS/CNES. High spatial resolution and improved accuracy in coastal areas will be needed at the start of the SWOT mission for CAL/VAL as well as to produce oceanographic results.
- CAL/VAL for Gravity Recovery — The third is to develop super resolution sea surface slope models along the tracklines of the commissioning phase using existing multibeam bathymetry surveys.
2. Approach
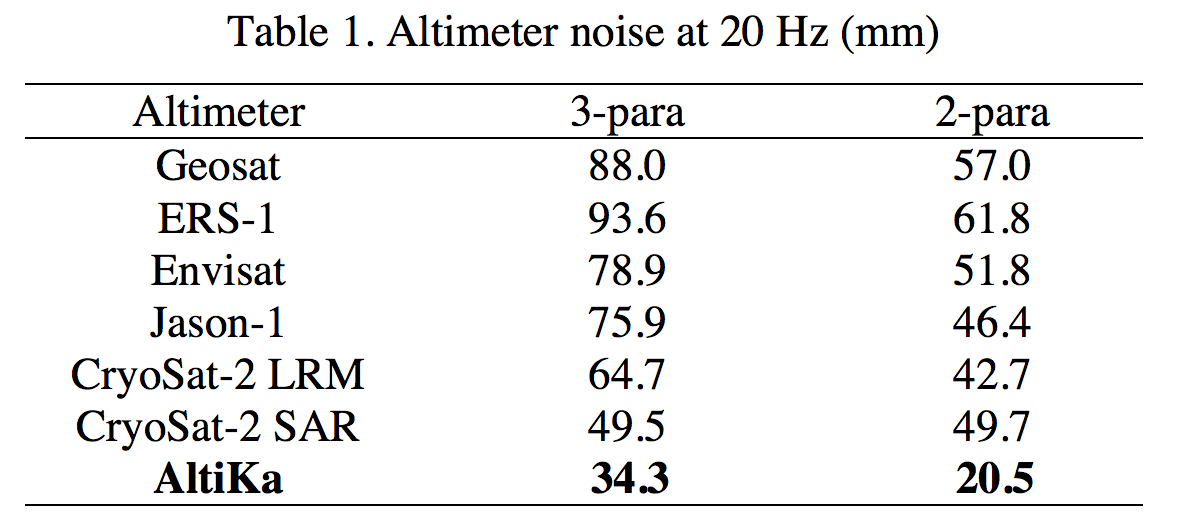
Waveform Retracking — Over the past two decades our group has worked with raw radar waveform data from Geosat, ERS-1, Jason-1, Envisat, CryoSat-2, and AltiKa to reduce the small spatial scale noise in the altimeter range measurements due to altimeter bandwidth limitations and ocean waves (Table 1 from Zhang and Sandwell, 2016). Ocean swell produces one of the largest errors in standard radar altimetry because the sharp radar chirp emitted by the satellite is blurred by reflection from the irregular ocean surface. The length of the blurring is related to the significant wave height so it is typically 1-2 m. Recovery of sea surface slope to an accuracy of 1 microradian over a horizontal distance of 10 km requires a range precision of 1 cm, which is 100 times smaller than the rise length of the leading edge of the return echo. This 100-fold improvement in range precision is achieved by averaging thousands of independent pulses both along-track and from near repeat cycles. Recovery of 1 microradian at 1 km length scale will require millimeter range precision. Through modeling, consultation with the SWOT engineers, and analysis of AirSWOT data we propose to achieve a better understanding of the fundamental limitations placed by the ocean swell signal on the recovery of the sea surface slope at the smallest scales in both the along-track and cross-track directions. This will help to guide the measurement requirements for ocean applications.
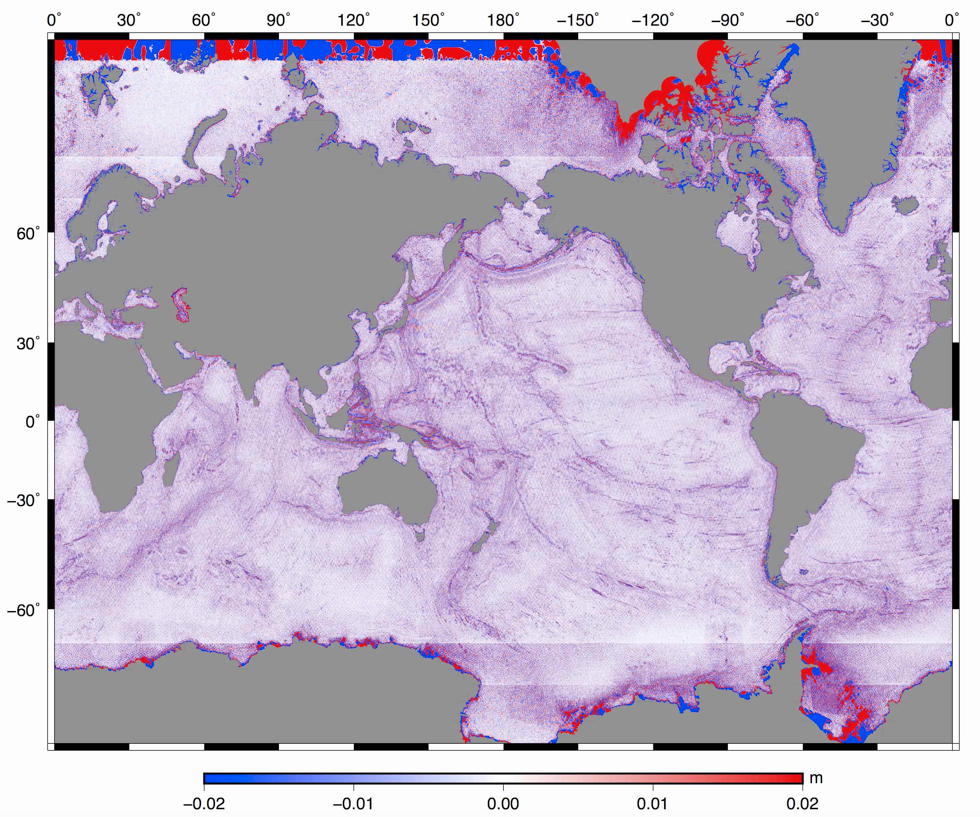
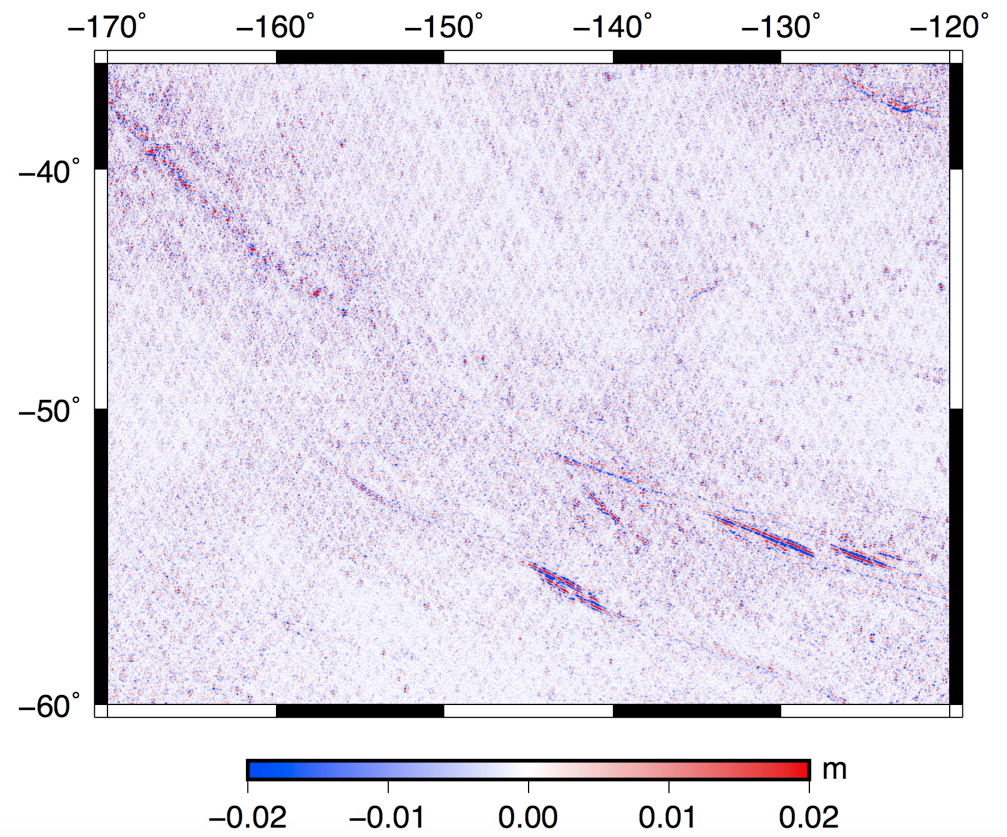
Mean Sea Surface — We are working with SWOT scientists at CLS/CNES (Phillippe Schaeffer and Gerald Dibarboure) to produce a new mean sea surface grid (MSS) at one-minute spatial resolution. High spatial resolution and good accuracy in coastal areas will be needed at the start of the SWOT mission for CAL/VAL as well as to produce oceanographic results. The method combines the accurate MSS along tracklines of repeat altimeters (e.g., Topex, Jason-1/2, ERS-1/2 and Envisat) with the retracked waveforms from the geodetic missions (Geosat, ERS-1/GM, Hason-1/GM, and Cryosat-2). An example of the difference between the new MSS grid and the original CLS grid is shown in Figure 3. The CLS group is currently evaluating this model.
CAL/VAL for Gravity Recovery — The third is to develop super resolution sea surface slope models along the tracklines of the commissioning phase using existing multibeam bathymetry surveys. We have identified 19 regions along the swaths of the commissioning phase where high-resolution multibeam data exist. The approach will be to take the best existing sea surface slope models and low-pass filter them at 25 km wavelength where we know they have accuracy better than 1 microradian. We will construct a very high-resolution geoid slope model from the bathymetry and high pass filter it at 25 km wavelengths. The two models will be combined to form a super resolution model of sea surface slope having ~2 km resolution above the crests of the shallow seamounts. These will be compared with the SWOT data to better understand its accuracy and resolution capabilities. The 19 regions provide a variety of oceanographic conditions of significant wave height and mesoscale variability.
3. Anticipated Results
These three analyses will be most valuable to the SWOT mission during the commissioning phase. The high spatial resolution, mean sea surface can be used to understand the cross-track accuracy of the SWOT data. The super resolution sea surface slope models will be useful in evaluating the performance of SWOT as well as to tune the algorithms and spatial filters for production of higher-level products. Following the commissioning phase we will work with the SWOT team to achieve the marine geophysics objectives.
4. References
Devey, C.W., R. Hékinian, D. Ackermand, N. Binard, B. Francke, C. Hémond, V. Kapsimalis, S. Lorenc, M. Maia, H. Möller, K. Perrot, J. Pracht, T. Rogers, K. Stattegger, S. Steinke, P. Victor (1997). The Foundation seamount chain: a first survey and sampling. Marine Geology. 137 (3–4): 191–200. doi:10.1016/S0025-3227(96)00104-1.
Garcia, E., D.T. Sandwell, W.H.F. Smith, 2014. Retracking CryoSat-2, Envisat, and Jason-1 Radar Altimetry Waveforms for Improved Gravity Field Recovery, Geophysical Journal International, doi: 10.1093/gji/ggt469.
Sandwell, D.T., R.D. Müller, W.H.F. Smith, E. Garcia, R. Francis, 2014. New global marine gravity model from CryoSat-2 and Jason-1 reveals buried tectonic structure, Science, Vol. 346, no. 6205, pp. 65-67, doi: 10.1126/science.1258213.
Zhang, S. and D.T. Sandwell, 2016. Retracking of SARAL/AltiKa Radar Altimetry Waveforms for Optimal Gravity Field Recovery, Marine Geodesy, DOI:10.1080/01490419.2016.1265032.
Zhang, S., Sandwell, D.T., Jin, T. and Li, D., 2017. Inversion of marine gravity anomalies over southeastern China seas from multi-satellite altimeter vertical deflections. Journal of Applied Geophysics, 137, pp.128-137.