Documents
SWOT in the Tropics: A Case Study in the South West Pacific
L. Gourdeau, F. Marin, and A. Ganachaud (LEGOS, Université de Toulouse, CNES, CNRS, IRD, UPS - Toulouse, France)
1. Introduction and Objectives
The tropics are distinguishable from the mid latitudes by a faster dynamics due to a Coriolis force decreasing to the equator, and a large Rossby radius of deformation that allows a large range of wavenumbers for meso and submesoscale interactions. Most of the studies on mesoscale and submesoscale dynamics concern the mid latitudes. It raises the question of the validity of these results for the tropics.
SWOT Observability in the Tropics
We are looking at the South West Pacific because of its complex circulation at the origin of a large diversity of high frequency dynamical processes at low latitudes (e.g. jets, mesoscale eddies, fronts/filaments, internal tides, island and topographic effects, western boundary current…). This is of particular interest to study the interaction of such dynamics with the large scale circulation that plays a strategic place in the climate system, especially to modulate the El Nino Southern Oscillation (SPICE/CLIVAR program).
Interaction of Meso/submesoscales with Ocean Circulation
Thus the tropical south west Pacific is clearly a challenge area for SWOT. We take advantage of local infrastructures at land and at sea in New Caledonia (IRD center in Nouméa), and of an important observational effort already underway in the area to propose a strategy for a cal/val experiment during the first phase of the SWOT mission defined by a 1-day repeat orbit. During this CalVal period,, operations at sea with R/V Alis and deployment of in-situ sensors will be shared between oceanographic and calval objectives.
Cal/Val Experiment
The approach is based both on analysis of numerical simulations, and existing and on-going observations. Several simulations using different model configurations already exist that allow preliminary analyses. A model development based on high resolution simulations with explicit tides will be used to answer the proposal objectives. Concerning the observations, we aim to study the short wavelengths available from SARAL/AltiKa, and to extract the high frequency signals from gliders and moorings.
In summary, this proposal aims at federating people from different communities working on climate, turbulence, models and observations in order to investigate how the high-resolution and high-frequency (1-day) measurements of SWOT could be dynamically interpreted and used in the tropics. The ultimate purpose is to propose for the next SWOT call a cal/val experiment based on the results of this proposal.
2. Approach
Our approach is based on the joint analysis of model simulations in support of a wide range of satellite and in situ data analyses.
Model
To study mesoscale and submeoscales activity from an OGCM, the model has to properly resolve the corresponding dynamical scales (i.e., be eddy-resolving). In the tropics, because of the larger Rossby radius, numerical convergence is obtained from 1/12° horizontal resolution, and higher resolution only seems to displace the dissipative range of the model toward smaller scale (Marchesiello et al., 2011).
In this paper, we first use a global model at 1/12° resolution operated in the DRAKKAR consortium to investigate the spectral signatures of the tropical dynamics (Tchilibou et al., in preparation). In a second part we use higher model resolution to investigate high frequency ageostrophic motions such as internal waves. Their signature on the SSH variable are a source of complication to retrieve the surface velocity field. Also, these motions with their potential to water mixing are dynamically important in the larger scale circulation.
A 1/36° regional NEMO simulation of the Solomon Sea (Djath et al., 2014) has been developed to include explicit tides. Hourly, and daily outputs are used to characterize internal tides in the Solomon Sea, and to analyze their effect on water mass transformation. To work on a cal/val experiment, an extraction around New Caledonia of the 1/48° global resolution MITgcm including tides is available (Rocha et al., 2016).
In Situ Data
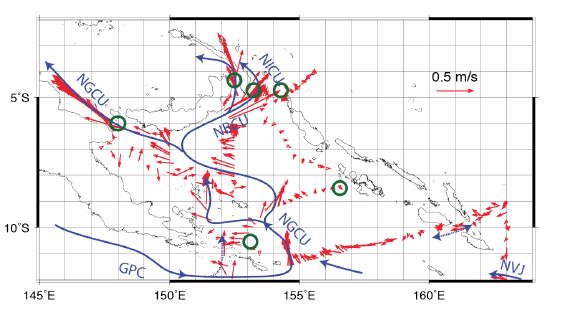
The Solomon Sea has been extensively observed for the last 10 years. Several cruises have been operated, and moorings have been deployed providing high frequency measurements (Figure 1). Since 2007, the Solomon Sea is repeatedly sampled by gliders (~ 3 missions per year). Analyses have mainly focused on Solomon Sea transports (Davis et al., 2012; Germinaud et al., 2016). These in situ data can be used to infer mixing due to high frequency motions, mesoscale eddies, and submesoscale dynamics (Alberty et al., 2017).
Altimetric Data
The new Saral/AltiKa mission enables to extend the observed wavenumbers to smaller scales than JASON, observing scales down to 30 km alongtrack in the tropics (Dufau et al., 2016). It provides high accuracy measurements until the coast for mesoscale, and coastal studies. So in preparation of SWOT mission, we will explore Saral/AltiKa to learn about the physical content observed at small scales.
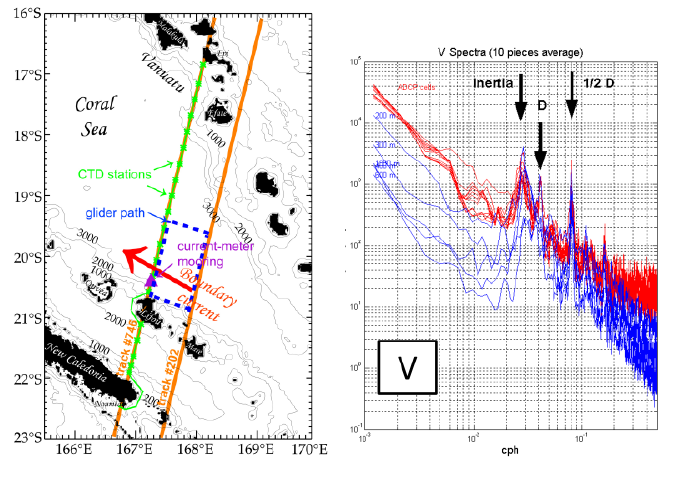
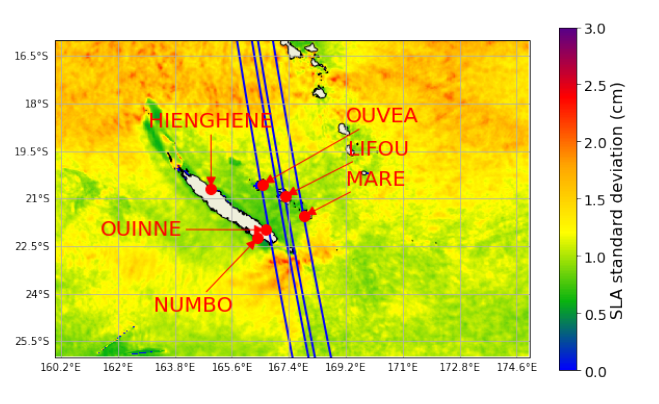
In the context of the AltiGlidex TOSCA/CNES project, moorings and gliders have been deployed under two Saral/AltiKa tracks to validate currents off Loyalty Islands (New Caledonia). All these datasets are likely to bring information on high frequency and small scales motions. For example, strong variability at inertial, diurnal, and semi diurnal frequencies has been observed at the mooring site (Figure 2).
3. Analysis and Anticipated Results
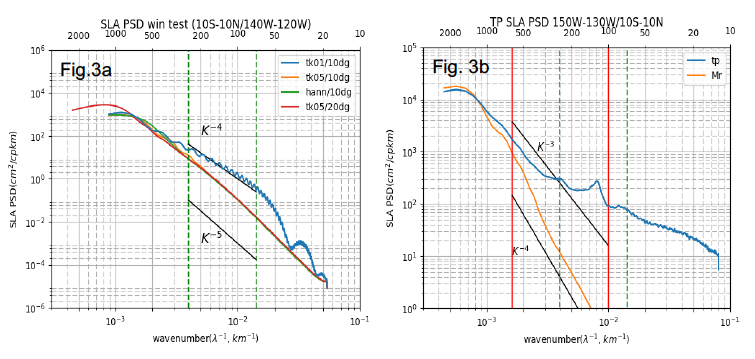
The calculation of SSH spectral slopes from alongtrack altimetry, evaluated over the 250-70 km mesoscale range, are very flat in the tropics compared to mid latitudes. This study revisits the Eddy Kinetic Energy (EKE) and SSH spectral signatures of the tropical dynamics estimated from a model and altimetry. SSH spectral shape and slope are sensitive to box and data size, particularly when using 10 % cosine tapering preprocessing (Figure 3a). A Tukey 0.5 window is recommended in the tropics. The off-equatorial region (poleward of 10°) reveals isotropic mesoscale structures within a 300-100 km mesoscale range. The equatorial region (10S-10N) is dominated by long planetary waves and TIW/TIVs, and a mesoscale band ranging from 700 to 100 km (Figure 3b). The 250-70 km range classically used to estimate spectral slope to infer mesoscale dynamics is not well suited to the tropics where the mesoscale energy level is relatively low, and altimetric spectra are particularly impacted by tidal and internal wave signals.
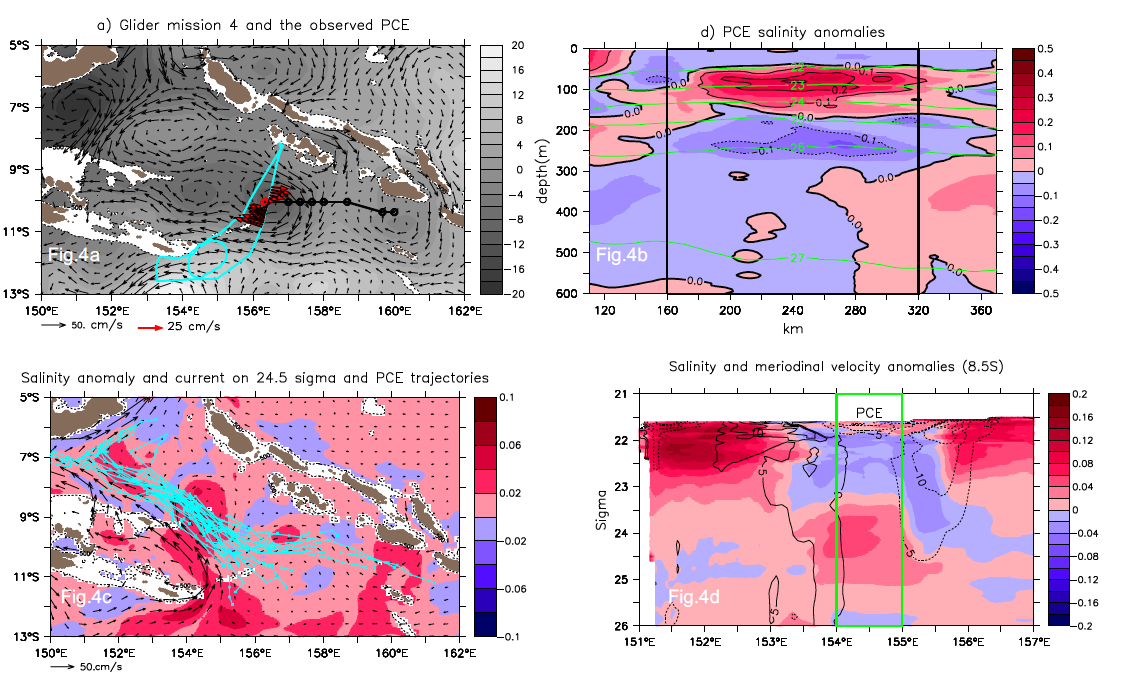
Mesoscale activity is an important component of the Solomon Sea circulation that interacts with the energetic low latitude western boundary currents of the South tropical Pacific Ocean. This study makes synergetic use of glider data, altimetry, and high-resolution model for exploring mesoscale eddies, especially their vertical structures, and their role on the Solomon Sea circulation. The description of individual eddies observed by altimetry and gliders provides the first elements to characterize the 3D structure of these tropical eddies (Figure 4a,b), and confirms the usefulness of the model to access a synoptic view of such eddies. In the Solomon Sea, mesoscale eddies appear to have a vertical extension limited to the Surface Waters and the Upper Thermocline Water, i.e. the first 140-150 m depth. They do not seem to strongly interact with the deep New Guinea Undercurrent that is a key piece of the equatorial circulation. But temperature and salinity eddy signatures suggest that anticyclonic eddies could play a role on mixed layer characteristics and in return, on local air sea interaction, whereas cyclonic eddies could be particularly efficient in diapycnal and isopycnal mixing (Figure 4c,d).
The SARAL/AltiKa satellite is the first ocean altimeter mission to operate in Ka-band frequency. The objective of this paper is to investigate the extent to which SARAL/AltiKa sea level measurements provide valuable information in a complex bathymetric region, the semi enclosed Solomon Sea. The data editing procedure is revisited and we propose two new data editing criteria. The first one is based on the detection of erroneous sea level values after computation and the second one analyzes directly the radar measurement and geophysical corrections. We show that both methods are significantly more efficient than the standard procedure used in operational processing chains. Sea level variations derived from altimeter data is very sensitive to the choice of the Mean Sea Surface Height used in the processing. The MSS_CNES_CLS11 solution provides the best result in our area. The performance of SARAL/AltiKA mission is finally evaluated in comparison with the classical Ku-band Jason- 2 altimeter. SARAL/AltiKa provides significantly more observations in the near-shore region. The lower level of instrumental noise in SARAL/AltiKA measurements modifies the shape of along-track sea level wavenumber spectra which appears closer to the information provided by regional numerical model studies.
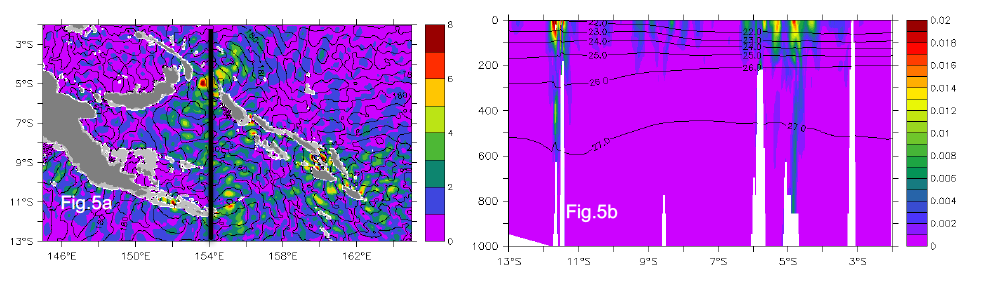
The Solomon archipelago is one of the most efficient places for the generation of M2 internal tides. Hourly snapshots are analyzed for January to March 1998 to obtain barotropic and baroclinic harmonic amplitudes and phases after projection onto the 10 first vertical modes. Three zones emerge for the generation of internal tides: two at the north and south extremity of the Solomon archipelago and one at the southeastern extremity of the PNG peninsula. The M2 baroclinic energy flux radiates from these zones inside and outside the Solomon Sea. At the surface, amplitude of M2 internal tides is about 4-5 cm reaching 8 cm in the generation zones (Figure 5a). With a well-marked stratification typical of the tropical oceans, M2 internal tides don’t propagate too deeply from the surface to the bottom as in mid-latitude regions. Instead, they are strong in the upper 200 m, and only penetrate deeply over bathymetry in generation regions (Figure 5b).
The Solomon Sea is a marginal sea in the southwest Pacific that connects subtropical and equatorial circulation, constricting transport of South Pacific Subtropical Mode Water and Antarctic Intermediate Water through its deep, narrow channels. Marginal sea topography inhibits internal waves from propagating out and into the open ocean, making these regions hot spots for energy dissipation and mixing. Data from two hydrographic cruises and from Argo profiles are employed to indirectly infer mixing from observations for the first time in the Solomon Sea. Thorpe and finescale methods indirectly estimate the rate of dissipation of kinetic energy (ε) and indicate that it is maximum in the surface and thermocline layers and decreases by 2–3 orders of magnitude by 2000 m depth. Estimates of diapycnal diffusivity from the observations and a simple diffusive model agree in magnitude but have different depth structures, likely reflecting the combined influence of both diapycnal mixing and isopycnal stirring. Spatial variability of ε is large, spanning at least 2 orders of magnitude within isopycnal layers. Seasonal variability of ε reflects regional monsoonal changes in large-scale oceanic and atmospheric conditions with ε increased in July and decreased in March. Finally, tide power input and topographic roughness are well correlated with mean spatial patterns of mixing within intermediate and deep isopycnals but are not clearly correlated with thermocline mixing patterns.
One year of a high-resolution ocean model (MITGCM 1/48°), which partly resolves Inertia Gravity Waves (IGW) and submesoscale dynamics, is analyzed in comparison with several in-situ observation around New Caledonia. The model is shown to reasonably reproduce subtidal sea-level signals as well as the diurnal and semi-diurnal cycles in comparison with tide gauge data. At supertidal frequencies, there is however less consistency between model and tide gauges ; those discrepancies might be explain by unresolved physical processes in the model or sensor noise in tide gauges. The supertidal sea-level variability is substantially impacted by nonstationnary IGW in two regions where the barotropic tides encounter steep topography (Figure 6). The Cal/Val orbit of SWOT will provide a nice opportunity to study those regions coupled with in-situ observations and other satellite observations.
Anticipated Results for SWOT
At this time, the knowledge on Solomon Sea eddies is based on relatively low resolution dataset. Therefore, it considers only a fraction of the meso/submesoscale range limited to the highest wavelengths (> 70 km). Meso/submesosscale dynamics will be revisited by considering the 1/36° resolution model in order to cover most of the meso/submesoscale range that will be observed by SWOT.
The study on the spectral signature of the tropical dynamics will help to remove ambiguity in the interpretation of the discrepancy between model and altimetry spectral slopes. Adapting the mesoscale range band used for slope estimation as a function of latitude in the tropics could help to reduce errors in spectral slope estimation from altimetry. Saral/AltiKa and the in coming Sentinel 3 SAR altimeter will be a stepping stone to SWOT.
Different sources of mixing exist inside the Solomon Sea that are important for water transformations, geochemistry and relevant for SWOT observability. The next objectives are to understand internal tide characterization, location, strength and phase; to understand what are the processes driving the mixing. We will focus on what sources and processes are important in water mass transformation, and in what isopycnal layers. We will study the interaction between internal waves and meso/submesoscale dynamics. Glider data and mooring data time series will be available for tidal model comparison.
In the New Caledonia Area, submesoscale dynamics and their imprint on sea-level, will be characterized in the future. The link with Sea Surface Temperature dynamics will be investigated to isolate submesoscale fronts in the sea-level signals and filter the imprint of IGWs. Daily-averaged sea-level Laplacian already shows a seasonal modulation of the submesoscale activity at this range of latitude.
References
Alberty, M. S., J. Sprintall, J. MacKinnon,A. Ganachaud, S. Cravatte, G. Eldin, C. Germineaud, and A. Melet (2017), Spatial patterns of mixing in theSolomon Sea, J. Geophys. Res. Oceans, 122, doi:10.1002/2016JC012666.
Djath, B., J. Verron, A. Melet, L. Gourdeau, B. Barnier, and J.-M. Molines (2014), Multiscale dynamical analysis of a high-resolution numerical model simulation of the Solomon Sea circulation, J. Geophys. Res. Oceans, 119, 6286–6304, doi:10.1002/2013JC009695.
Dufau, C., Orsztynowicz, M., Dibarboure, G., Morrow, R., and Le Traon, P.-Y.: Mesoscale resolution capability of altimetry: Present and future, J. Geophys. Res.-Oceans, 121, 4910–4927, doi:10.1002/2015JC010904, 2016.
Germineaud, C., A. Ganachaud, J. Sprintall, S. Cravatte, G. Eldin, M.S. Alberty, and E. Privat (2016), Pathways and water mass properties of the thermocline and intermediate waters in the Solomon Sea, J. Phys. Oceanogr., 46(10), 3031–3049.
Marchesiello P., X. Capet, C. Menkes, and S.C. Kennan, 2011: Submesoscale dynamics in Tropical Instability Waves. Ocean Modelling, 39, 31-46.
Rocha, C.B., T. Chereskin, S.T. Gille, and D. Menemenlis (2016): Mesoscale to submesoscale wavenumber spectra in Drake Passage, J. Phys. Oceanogr., 46, 601-620, doi:10.1175/JPO-D-15-0087.1.
Tchilibou M., L. Gourdeau, R. Morrow, B. Djath, J. Jouanno, and F. Marin, Spectral signatures of the tropical dynamics from model and altimetry, in preparation.