Where are SWOT Early Adopters?
Learn about this growing community working to incorporate future SWOT data into their activities. The locations of Early Adopters are shown in the map and their summaries are included below. View the SWOT Early Adopters Guide. There are currently 40 Early Adopters.
Alexandria University, Egypt
Title: Integrating Surface Water and Ocean Topography (SWOT) Mission into the Operational Nile Basin Reservoir Advisory System (NiBRAS)
Organization: Alexandria University, Egypt, Faculty of Engineering
Leads: Dr. Hisham Eldardiry; Dr. Mohamed Elkholy; Dr. Ahmed Abdelrazek
Summary
The Nile River Basin (NRB) is home to more than 200 million people sharing the water resources for agriculture, industry, municipal uses, in-stream navigation, and hydropower generation. A central and existential water management issue for the region is maintaining a sustainable supply of water against increasing population, recurring drought, and climate change. Recent published datasets on future dams reveal an increasingly impounded NRB for hydropower development by upstream and transboundary nations, notably Ethiopia (Figure 1). The most downstream country, Egypt, therefore needs to adapt the operation of High Aswan Dam (HAD), which is key to the country’s water security, to planned dams, such as the Grand Ethiopian Renaissance Dam (GERD). The overarching goal of this project is to improve dam operations in the Nile basin by harnessing the satellite measurements from the Surface Water and Ocean Topography (SWOT) mission.

The two key elements for our project are: 1) to test/apply SWOT synthetic data for lake water balance analysis and modeling with focus on Lake Nasser (HAD reservoir); and 2) to test the integration of SWOT data/products into the operational Nile Basin Reservoir Advisory System or (NiBRAS). The NiBRAS system has recently been developed by Hisham Eldardiry (one of the EA team leads) as a satellite-based framework to facilitate the understanding of the water management issues associated with reservoir operation in the NRB and provide a basis for evaluating potential solutions (Figure 2). The outcomes from our SWOT EA project are intended to support SWOT research efforts in improving dam operations and build stronger capacity for using SWOT observations in monitoring surface water resources in the Nile River basin.

ANA Brazil (National Water and Sanitation Agency of Brazil)
Title: SWOT Data Application in the National Water and Sanitation Agency of Brazil (ANA)
Organization: National Water and Sanitation Agency of Brazil (ANA)
Leads: Alexandre de Amorim Teixeira, Alexandre Abdalla Araujo, Saulo Aires de Souza, Vinícius Roman, Dhalton Luiz Tosetto Ventura
Summary

ANA's current spatial database for hydrology studies, the National Hydrographic Database of Brazil (NHDB), consists of more than 5 million cartographic drainage lines topologically consistent for entire Brazil, and a spatial layer that represents the water bodies for the entire country. This spatial layer defines a multiple-scale water body database with more than 250 thousand features characterizing natural water bodies (lakes, ponds), artificial water bodies (reservoirs, dams), large rivers, and sea entrances such as estuaries, channels, and bays.

SWOT data can support the hydrological modelling process by providing additional data for the evaluation and improvement of hydrological models used by ANA in Brazil. The satellite data can also provide reservoir storage information essential in estimating regional water availability, especially regarding the agricultural water demand in several Brazilian regions. In addition, SWOT data can support ANA's efforts to develop two activities that need altimetry data from floods in medium to large rivers, such as the definition of reference levels for a flood warning display system in periods of flooding and the Flood vulnerability atlas. Lastly, ANA's National Hydrometeorological Network (RHN), which is a set of more than 4000 meteorological and hydrological stations, can benefit from SWOT data by improving the monitoring of water level and discharge.
Overall, ANA's proposed early adopter application of SWOT data can improve their water resource management and decision-making processes.

Argentine Water Research Centers
Title: Utilization of SWOT data for water resources management for lakes and large rivers in Argentina
Organization: Argentine Water Research Centers
Leads: Dr. Ricardo N. Szupiany; Dr. Carlos M. Garcia; Dr. Esteban Gabriel Jobbagy Gampel; Kevin Oberg
Summary
Large Paraná River system
The Paraná River drainage basin covers an area of 2.3 × 10⁶ km2 and includes parts of Argentina, Brazil, Bolivia and Paraguay. Downstream of the major confluence with the Paraguay River, near Corrientes City, the mean annual discharge is of 19,105 m3 s−1 (1970–2019 period) and the water surface slope is in the order of 10−5. The hydrological characteristics of this reach are governed by upstream contributions from the upper Paraná basins and the Iguazú and Paraguay Rivers. Downstream of the confluence of the Paraguay River, along the middle reach, the contributions of its lateral tributaries do not exceed 1,000 m3 s−1 and account for only 5% of the total discharge with no significant sediment transport input. Large discharges (up to 21k m3 s-1) typically occur during February–March and August–September in the general region.

The complex and intricate stream channel network located in the active floodplain of the Paraná River along its middle reach near Santa Fe city (Figure 1) will be studied. The Leyes Channel starts in the confluence of two Paraná secondary channels, Colastinecito and San Javier (see Figure 1), respectively.
Gage network and previous research work on the Parana river system are sparse, limited spatially to select cross sections, so new technologies like SWOT can allow for better monitoring with larger temporal and spatial scales. The SWOT orbit will cover most of the middle Parana river reach, it provide the opportunity to look more at reach-scale dynamics or processes. Particularly, we propose to use the detailed SWOT data to analyze changes of water surface elevation and the variation of surface water slopes and their use to estimate discharge along the complex braided channels configuration. The more detailed information will increase our understanding of the system, its behavior and complex associated processes. Furthermore, this information will be key for the calibration/validation of numerical models that allow the development of tools for their control and management, especially during extreme conditions and prediction of their continuous natural changes and products of anthropic factors.
Lagoons and lakes
The second focus region encompasses one of the flattest portions of the Chaco-Pampas plains in sedimentary landscapes that have been shaped by wind and host a myriad of shallow blow-out lagoons and lakes. The region has highly fluctuating water coverage that in some areas can be as much as half of the landscape in wet years and almost no water coverage in dry years. Some of these lakes, located close to one of the cross-over zones of SWOT, have already been sampled and gaged in one of the most extreme droughts ever recorded. We expect rising water levels for this reason in the coming years and the opportunity to detect how slight water level changes propagate into wide areal changes in most of these lakes. Also of critical interest in the region is the detection and quantification of (i) the coalescence of lakes as they grow in size and (ii) the resulting regional water level gradients and surface fluxes. Another highly interesting aspects of the level of these lakes is their sensitivity to gradients created by wind and by contrasting precipitation rates in the context of the extremely low regional slopes. Connecting lake level estimates, with lateral surface flow estimates and, ultimately, measured river discharges, will offer a unique testing opportunity for the SWOT data and a breakthrough for the current hydrological function of the Pampas plains. The team will offer field data and remote sensing analysis using multiple sources (e.g. landsat, modis, GRACE) in the broader effort of evaluating SWOT data and finding novel applications for it.
Proposed Work in Paraná River Basin
- Evaluate SWOT discharge product, computed from SWOT measurement (i.e. river water surface elevation, width and slope) and ancillary data.
- Evaluate, validate and develop methods (if necessary) to estimated additional proprieties of global rivers needed to produce discharge estimate (i.e. coefficient governing hydraulic resistance in the river).
- To use SWOT measurement and discharge estimation to produce a better understand the flow, sediment transport and morpho-dynamics of this complex anabranching rivers like Paraná, presenting continuous interaction between its main and secondary channels.
Proposed Work in Argentina Lakes
- Evaluate SWOT level product in 6 to 10 gaged lakes located in the path cross-over region.
- Evaluate and develop methods to estimate surface water level gradients within and across lakes using SWOT throughout a level rising period, expected to occur under the ongoing El Niño conditions.
- Identify fast and slow responding lakes based on their rising level trends with SWOT and connect these dynamics with (i) past history of water coverage with LANDSAT and salinity conditions based on field sampling and existing salinity records.
Asian Disaster Preparedness Center (ADPC)/SERVIR-Mekong
Title: Plugin SWOT to Enhance Water Resource Management in Lower Mekong Region
Organization: Asian Disaster Preparedness Center (ADPC)/SERVIR-Mekong
Leads: Susantha Jayasinghe (Technical Specialist-ADPC); Chinaporn Meechaiya (Hydrologist-ADPC)
Summary
This project will establish virtual stream gauges (VSG) in the Lower Mekong Region (LMR) region of southeast Asia using pre-SWOT or SWOT-relevant data. Data products at these VSG locations will be used to generate water level elevations. These VSGs will be located over many streams (including small and larger streams). These multi-scale data will help explore SWOT's advance technical capabilities to improve temporal water level analysis, reservoir/lake outflow estimations, and water level forecasting for major rivers by taking the advantage of water discharge output with the Variable Infiltration Capacity (VIC) model.
One of the existing challenges is to forecast the water levels in the streams of Mekong delta due to ocean tidal effect. This project will, therefore, closely monitor water levels deriving from SWOT VSGs over Mekong delta and would improve existing VIC and ocean tidal model's setup to forecast the water levels in Mekong delta utilizing up streams discharges and water levels.
Other elements of this project include:
- Application of soil water assessment tool (SWAT) to plug in water levels/depth/discharges from SWOT to enhance the tool scope area to cover the LMR. This can potentially improve water resources management in the region, and help to solve transboundary issues (from a lack of hydrometric data) in the upper Mekong basin in Tibet, Myanmar and China.
- Improving accuracy of products from the Regional Drought and Crop Yield Information System (RDCYIS) by using surface water observations from SWOT and GRACE/GRACE-FO ground water storage data. The assimilation potential of these data will be explored for the Regional Hydrologic Extremes Assessment System RHEAS modeling framework to improve the predictions of extreme droughts.
Current Progress and Future Steps
BRL Ingénierie (BRLi)
Title: Toward a better water resources management with altimetry and the future SWOT mission
Organization: BRL Ingénierie (BRLi)
Leads: Damien Brunel; Laurent Tocqueville; Stéphane Delichère
Summary
BRLi is a consulting firm specialising in areas related to water, the environment and regional planning, providing design and construction engineering, management services and technical assistance on integrated water resource management, hydraulic, port and navigation infrastructures, protection of the environment and coastal areas and natural risk management. BRLi is an expert in hydrology and hydraulics and has integrated satellite data in its projects since years. As designer and provider of downstream services, BRLi has developed the solution WIMES, a software and services platform, for building water information and management systems and aid decision tools. BRLi is part of the French working group on Space Hydrology lead by CNES, AFD – the French development agency and IOWater. This groups aims to promote the use of space data in hydrology and to prepare the use of SWOT data.
BRL is particularly interested in ungauged basin/river to help basin's holder to have a better water resources management. It also has applications on navigations and flooding maps and forecast.
Centre for Water Resources Development and Management (CWRDM), Kerala, India
Title: Leveraging Citizen Science for Estimation of Lake Volumes using SWOT
Organization: Centre for Water Resources Development and Management (CWRDM), Kerala, India
Leads: Dr. J. Indu (IIT Bombay); Mr. Vivek B (CWRDM); Mr. Jainet P. J (CWRDM)
Summary
This project will monitor lake storage change through a Citizen Science project over the Pookode Lake, Wayanad, Kerala, India. The project will serve as a case study for a larger India Citizen Science lake study initiative. The research objectives include assessing the performance of SWOT to establish limitations on the lake storage variation due to KaRIN instrument limitations. A secondary objective is to estimate lake water volume using existing satellite missions/repositories such as those on Hydroweb, as well as for SWOT after launch.
PI Dr. J. Indu, from the IIT Bombay, has expertise in working with satellite altimetry datasets and is presently involved in projects on SWOT. Her research team shall focus on the processing of satellite altimetry data. The collaborators, Mr. Vivek B and Mr. Jainet P J, are working as Scientists-B with the Centre for Water Resources Development and Management (CWRDM), Kerala, India. Their team shall focus on the establishment of the in-situ site at the Pookode Lake case study area.

Cleveland Water Alliance (CWA)
Title: Exploring SWOT data integration with Cleveland Water Alliance Smart Lake Data
Organization: Cleveland Water Alliance (CWA)
Leads: Ge (Jeff) Pu; Ebie Holst
Summary
There is currently no wave height or water level information across the entire Lake Erie. SWOT may provide complete coverage of Lake Erie wave height and water level information synergistic to CWA’s streaming data as a means to better inform various Lake Erie industry, utility, agriculture, maritime, research, and recreational interests regarding conditions that may affect water safety, navigation, treatment, and management. The integration of SWOT data would be fairly simple, using ArcGIS Online to periodically import the latest SWOT data on wave height and water level. ArcGIS Online has the ability to periodically check for the latest SWOT data and automatically publish it into the CWA data platform.
Collecte Localisation Satellites
Title: SWOT data to be included in a Water Resources database
Organization: Collectie Localisation Satellites (CLS)
Leads: Fabien Lefèvre; Guillaume Valladeau
Summary
CLS collects, analyses and disseminates satellite hydrological parameters to provide databases and services monitoring surface water and natural resources based today on remote sensing observations and in situ data. CLS works also on numerical modelling data. It develops also management tools and databases for hydrological parameters, hydrological monitoring and in the future plans to include forecasting services.
CLS will integrate SWOT data in the Hydroweb database and plans to use SWOT data for validation and calibration of numerical models.
Compagnie Nationale du Rhône
Title: Examining the potential of SWOT in hydropower and navigation
Organization: Compagnie Nationale du Rhône (CNR)
Lead: Sébastien Legrand
Summary
Since 1933, based on the concession received by French Government, CNR has been developing the Rhone River according to three core missions: hydropower generation, inland navigation and irrigation. Designer and operator of 19 run-of-river projects with 85 years of experience, CNR also supports other stakeholders in the fields of hydropower and river engineering to sustainably develop basins and rivers.
CNR is part of the French working group on space hydrology led by CNES, AFD – the French Development Agency – and the International Office for Water. This group aims at promoting the use of space data in hydrology and to prepare the use of SWOT data (SWOT satellite to be launched in 2021).
CNR is particularly interested in ungauged basin/river and long time series of water level that could be made available to end users thanks to SWOT. CNR already uses altimetry data to develop operational applications in the field of water resources management, hydropower potential assessment and navigation forecasting.
Consortium of Universities for the Advancement of Hydrologic Science, Inc. (CUAHSI)
Title: Connecting the water science community to SWOT
Organization: Consortium of Universities for the Advancement of Hydrologic Science, Inc. (CUAHSI)
Lead: Dr. Jerad Bales (Executive Director, CUAHSI)
Summary
Key components to CUAHSI's mission are the HydroClient and HydroShare portals that support the water science community in accessing available datasets and hosting user-developed data and applications. CUAHSI's HydroClient currently provides the water science community with access to nearly 7 million time-series data sources (e.g., NASA's NLDAS). The inclusion of select SWOT data products, development of tools to assess the space-time sampling of SWOT, and hosting of user data/findings related to SWOT are well-aligned with CUAHSI's efforts to provide unprecedented access to water data at a global level and to support rapid advances in coupled water-climate-terrestrial modeling.
Building on CUAHSI's Water Data Services, CUAHSI, in collaboration with the SWOT Science Team (ST), Applications Working Group (SAWG) members and NASA PO.DAAC representatives, will explore optimal methods for; (i) hosting of available synthetic SWOT data products, and (ii) enabling web services for exploring available synthetic SWOT data products and subsetting non-SWOT datasets (e.g., in-situ or simulated water surface elevations, water extents, and river discharges for lakes and rivers) to reflect the space/time sampling characteristics of SWOT. Corresponding SWOT data product uncertainties will also be included based on findings and simulator developments from the SWOT ST. The subsetting web services are primarily intended to help users explore SWOT's space/time sampling within their river basin(s) prior to launch.
Environment and Climate Change Canada (ECCC)
Title: Using SWOT data/products to enhance lake hydrology research in central Canada
Organization: Environment and Climate Change Canada
Lead: Chris Spence
Summary
This project focuses on lakes and rivers in Canadian prairie, boreal and shield regions. The selected lakes and rivers have level and discharge measurements dating back sixty years or more. The sites are key SWOT research sites in Canada, all under the SWOT cal/val orbit and flight lines from the 2017 AirSWOT campaign. The main goals for the projects are a) to develop SWOT data for use in operational hydrometric (stream discharge and lake level) observations; and b) to apply SWOT data in regional and national assessments of water availability. This project will support SWOT lake calibration and validation activities in Canada, while enhancing research collaborations with other participating agencies and universities in Canada.
ESRI
Title: Supporting SWOT Products in ArcGIS
Organization: ESRI
Lead: Nawajish Noman, PhD
Summary
ArcGIS, a suite of GIS software, offers unique capabilities for applying location-based analytics to natural resources applications. Scientists, researchers and analysts can gain greater insights using contextual tools to visualize and analyze their data. They can collaborate and share via maps, apps, dashboards and reports.
ESRI will ensure that SWOT products can be read in ArcGIS using existing capabilities. New tools were created, for example, considering SWOT pixel cloud product. This will more readily facilitate the use of SWOT in this important GIS tool. We will work to understand various applications of SWOT products and evaluate how ArcGIS capabilities can be used for data visualization, exploration and analysis. We ill demonstrate the capabilities and best practices using sample SWOT products and identify capability gaps so that ArcGIS can be enhanced to better work with SWOT products.
We will work closely with the SWOT Early Adopter community to identify the most common applications and work together to develop with best practices and analytical workflows.
FM Global
Title: Calibration of hydrologic and hydraulics models used for flood hazard mapping using synthetic SWOT data products
Organization: FM Global
Lead: Dr. Alain Dib (Senior Research Scientist)
Summary
FM Global will perform incremental assessments of synthetic SWOT data products to: (i) ensure they meet suggested accuracy and uncertainty expectations, (ii) fully understand the unique space-time sampling impacts, (iii) quantify how they may add value to local/regional hydrologic and hydraulic understanding, and (iii) integrate relevant data products into the flood mapping workflow if needed. Case studies will be explored in collaboration with SWOT Science Team and Applications Working Group member, Ed Beighley-Northeastern University, to address the above. For example, the Ohio River Basin may be one of the initial experimental basins.
Current Progress and Future Steps
French National Research Institute (IRD)
and Geological Survey of Brazil (SGB)
Title: SWOT for support to monitoring extreme hydrological events
Organizations: French National Research Institute (IRD) and Geological Survey of Brazil (SGB)
Leads: Daniel Medeiros Moreira (SGB and GET-France), Fabrice Papa (IRD/LEGOS), Jefferson Melo (SGB), Stéphane Calmant (IRD/LEGOS), Adrien Paris (HydroMatters and LEGOS), Marcus Suassuna Santos (SGB), Luna Gripp Alves (SGB) and Artur Mattos (SGB)
Summary
The Geological Survey of Brazil (SGB) operates 17 warning water level systems in the Brazilian territory. Some of these systems are operated in transboundary basins with lack of hydrological information, especially outside the Brazilian territory and at countries border regions. The main goal of the project is to benefit from SWOT observations and to help SGB warning water level systems to densify the hydrologic information in the monitored basins. This will provide new important information in remote regions and other non-monitored areas, especially in the Amazon and Paraguay River basins (Brazilian Pantanal).
In these regions (Pantanal and Amazon), over the last decade, extreme events (floods and droughts) are increasing and affecting the population that historically have their life, transport and economy driven by the river water level.
One pilot application will be made in the Amazon Negro River basin, where SWOT one day cal/val orbit is available, taking advantage of the SWOT Science Team project “SWOT for South America.”

Current Progress and Future Steps
FUNCEME - Meteorology and Water Resources Foundation of Ceará
Title: Assessment of SWOT data for the detection, characterization, and monitoring of small reservoirs in the Brazilian Northeast
Organization: FUNCEME - Meteorology and Water Resources Foundation of Ceará
Leads: Dr. Eduardo Sávio Passos Rodrigues Martins; Dr. Marielle Gosset; Dr. Alfredo Ribeiro Neto; Dr. Antonio Geraldo Ferreira; Rafael Reis Alencar Oliveira, PhD Student
Summary
In the semi-arid Northeast (Nordeste; NE) of Brazil, water resources are disseminated through more than twenty thousand reservoirs ranging from 0.5 to 25,000 ha, including state monitored reservoirs larger than 5,000 hectares, and small farm reservoirs of less than 1 ha. Over the years, and as the region has experienced several severe droughts, the number of small reservoirs has grown chaotically. The huge number and reduced size of these “açudes” make it challenging to inventory them and to monitor the amount of water they hold. On the other hand, there is more and more evidence that these small water bodies have a considerable impact on the water balance of their basins, and on the water resources available to fill in the state’s reservoirs. Documenting and monitoring these small reservoirs has become a key issue for water management in Ceará (and the Northeast, more generally). Remote sensing can play a central role for this in the future.
In Ceará, the water level of 155 large state reservoirs,ranging in size from 5.000 to 60.000 ha, are currently monitored daily in situ. However, the vast majority of other reservoirs do not benefit from regular in situ measurements. Remote sensing (Landsat images) has been used to detect the reservoirs, provide a partial inventory (in only some basins) and analyze their evolution at the interannual scale (based on their maximum extension). The quality of water is also surveyed in some reservoirs through in situ and satellite observations. A more frequent and more systematic monitoring of water areas and volumes is needed in order to survey the state of the water resources throughout the year and in the long term.
In addition to observations, several hydrological models have been implemented in various basins of Ceará. In particular, the MGB-IPH model (IPH; Porto Alegre; Brazil) and SWAT. The configuration and validation of these models suffer from insufficient amounts of data on the bathymetry or long time series of water balance components for all water bodies. The global coverage and high-resolution products expected from SWOT could help improve these models at different stages: bathymetry and other water bodies characteristics from SWOT measurements will help the initial set up of models; the SWOT time series will be useful for model calibration/validation; and during the model real time operation, SWOT data could be assimilated for dynamical constraint of the model’s trajectories.

Geometric Data Analytics, Inc.
Title: Submesoscale Eddy Identification and Tracking in SWOT
Organization: Geometric Data Analytics, Inc.
Leads: Kenneth Ball; James Polly
Summary
Geometric Data Analytics will use SWOT altimetry data to identify ocean surface eddies and create surface velocity data products. The value of these efforts include marine renewable energy characterization, navigation of maritime vessels, and others.
Geometric Data Analytics has successfully employed feature tracking algorithms to identify oceanic submesocale eddies and track them in time (see citation and figure). This has been performed using ocean model data products (forecast and reanalysis) as an input to the tracking algorithm. SWOT altimetry will permit construction of a geostrophic velocity field at the surface, and permit eddies to be identified and tracked in a similar manner.
To perform eddy tracking between successive passes of the polar orbiter, the SWOT simulator and ocean model products (e.g., HYCOM, MIT-GCM, etc.) will be utilized to refine the tracking algorithm to handle the relative sparsity of the SWOT observations.
Eddy identification and tracking is used to characterize upper ocean acoustics and velocities. Applications include military planning, renewable energy resource mapping, navigation of maritime vessels, and more. These application areas are not new and coarser altimeter observations or less reliable model data products are currently used. In some cases, identification of surface eddies is done manually (e.g., at the Navy Fleet Numerical Meteorology and Oceanography Center) and this process can not only be automated with the tracking algorithms we have developed, but the quality of the result may be improved with the use of higher resolution observations from SWOT.
Demonstrating the feasibility and advantage of moving SWOT observations into the routine operations of the above applications would be an outcome of the applicant’s efforts. To overcome some of the basic challenges, including SWOT observation sparsity, applicants will incorporate a combination of physical modeling and statistical methods (“AI/ML”) for inference when measurements are unavailable.
ICUBE SERTIT
Title: Support for the development and validation of a priori water masks, databases and lake processing, and CALVAL SWOT HR activities
Organization: ICUBE SERTIT, UMR UNISTRA-CNRS 7357, Université de Strasbourg – UNISTRA
Lead: Dr. Herve Yesou
Co-Investigators: J. Maxant, IR - ICUBE SERTIT; T. Ledauphin, IE - ICUBE SERTIT; S. Amzill, IE - ICUBE SERTIT
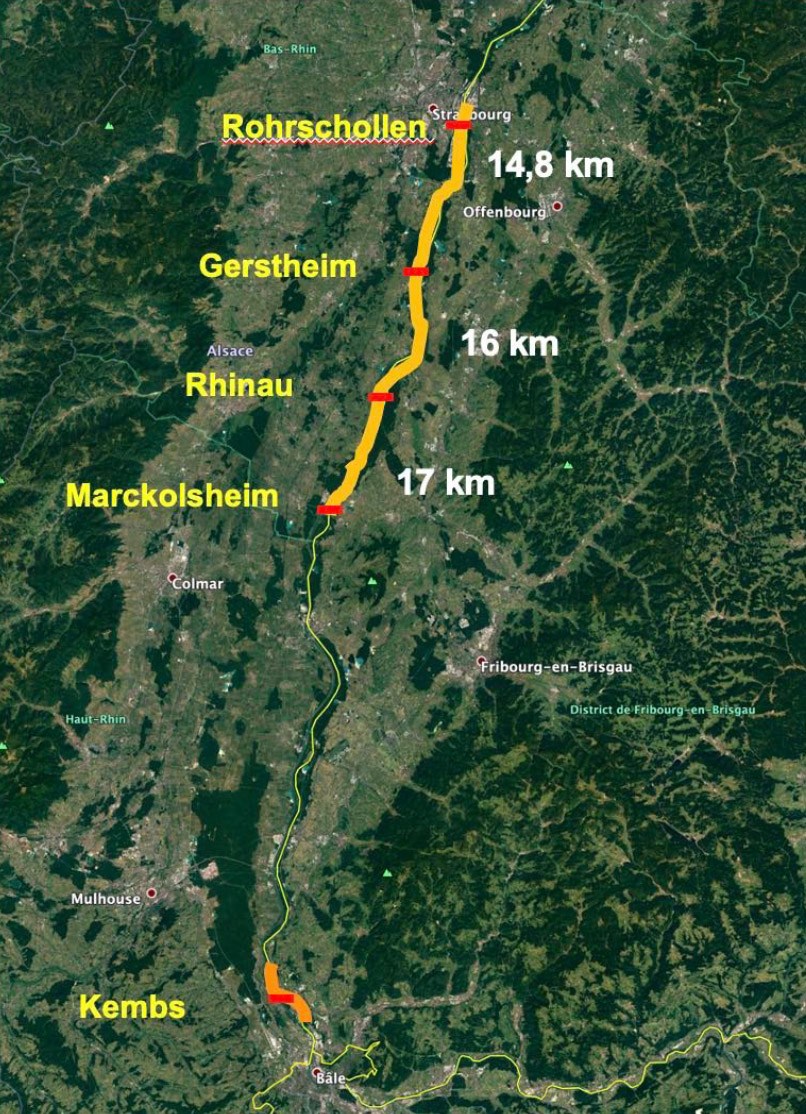
Summary: SERTIT supports the CNES SWOT project team to build a priori data sets and to set up a Calval plan over the Rhine Tier 1 site within the Grand Est Region or France. The main objectives of the study are to provide support to the CNES team on:
- The improvement of the a priori masks for the processing of SWOT HR L1 data, from several information sources,
- Validation of the a priori lake and river databases for SWOT HR L2 processing and products
- Validation of the lake algorithms
For the CalVal part, within the Grand Est Region, two sets of sites have been proposed, these are:
- Sectors of the Rhine between Strasbourg and Basel. The Rhine is particularly interesting because of its configuration as a staircase in the "French" part and then as a free course (with a slope) and a course that can then be parallel or perpendicular to the satellite track (which makes it possible to study/analyze the effects/bias of the measurements related to the operation of the satellite (roll/pitch). The West-East offset between the Canal Rhine and the Old Rhine is interesting for SWOT due to their proximity – will SWOT be able to differentiate between these “two Rhines”?
- A group of lakes, reservoirs and ponds located on the Lorraine plateau, in the Vosges mountains, and water bodies (gravel pits, pounds) on both sides of the Rhine. The lakes in Lorraine and the Vosges are also interesting targets for analyzing the capabilities of monitoring reservoir volumes and in terms of technical limits (case of deep lakes, such as Lac Blanc, Pierre Percée, Gérardmer); the lakes in Lorraine are assumed to be more easily exploitable targets.
Figures:

Indian Institute of Technology Bombay
Title: Examining the potential of SWOT mission in Hydrometeorology over India
Organization: Indian Institute of Technology Bombay
Leads: J. Indu; Subimal Ghosh; Subhankar Karmakar
Summary
In order to derive weekly/monthly estimates of river discharge, this project will use data assimilation to generate continuous fields of SWOT-relevant observables by merging them with model predictions. This will provide hydrologic information in areas where SWOT data gaps will prevent direct observation. The research objectives of this project are:
- Evaluate various data assimilation (DA) techniques on synthetic SWOT measurements to generate improved SWOT observables
- Uncertainty quantification of SWOT orbital data products
- Using SWOT measurements for the creation of a data inventory towards flood forecasting for different hydro-climatic scenarios
Current Progress and Future Steps
Indian Institute of Technology Delhi
Title: Examining the applicability of SWOT in improvising flood forecasting, inundation mapping and mitigation over Indian river basins
Organization: Indian Institute of Technology Delhi
Lead: Dhanya C.T.
Summary
This project will evaluate solutions to extract the (near) real-time continuous information on:
- Surface water extent or width,
- Water level, and
- Slope
from satellite data of the river reaches by developing suitable machine learning algorithms. They propose to adopt an exercise involving multi-source satellite data (optical, SAR and altimeter satellites), error identification and correction, coupled with in-situ dense data procurement, hydro-dynamic models, and meteorological information of the river basin. A pilot study over the Godavari basin, the second largest basin in India after the Ganga basin, will be conducted in association with officials from Central Water Commission (CWC), Govt. of India. For more information, visit HydroX.
Current Progress and Future Steps
JBA Consulting
Title: Application of SWOT to characterize hydrologic systems, water resources and flooding
Organization: JBA Consulting
Lead(s): Cain Moylan (Senior Analyst); John Bevington (Technical Director)
Summary
JBA Consulting has a long track record of developing flood hazard and risk data globally, both at broad scale and local scale, and particularly in support of International Development assignments in data-scarce regions. In these projects, we develop models of regional hydrological systems that support assessment of flood and drought risk, water resource modelling and fluvial morphology. Data used to inform these studies are often tertiary and used to infer the likely state of the hydrological system. Information on water resources is often unreliable, with incomplete time series. In-country survey data are sometimes collected, often with significant limitations. As a result, estimates of discharge in these regions can be sparse, irregular and unreliable.
Modelling of hydrological systems includes characterizing the behavior of larger bodies of water present within the study area, including lakes, reservoirs, and large rivers. These are essential components of regional water studies, as they represent a significant proportion of a system’s water balance. As there has been no globally consistent inventory, there is still a great reliance on information sources from literature. While at times there are good sources of information available, it is a common problem to find these systems ungauged, and therefore represented by inference and hydrological judgement.
SWOT will allow us to better characterize and validate hydrological systems in data-scarce regions. Water levels can be used to calibrate hydrological models more appropriately. The conversion of altimetry to discharge is of particularl interest as it would create a steadily growing time series of discharge estimates of rivers around the globe. Although these estimates are modelled and therefore have an associated uncertainty, it is expected that they would still be more reliable than discharge estimates acquired from alternative sources.
If testing is successful, we intend to operationalize the use of SWOT in our global modelling studies. We would develop routines to integrate SWOT data into our analytical platforms to allow for wider uptake of SWOT data across our hydrological, water resources and flood modelling teams.
Magellium
Title: Assimilating SWOT observations into a large scale hydrological model: case studies over African ungauged basins
Lead: Dr. Vanessa Pedinotti
Summary
This study is part of a work carried out under CNES supervision on the assimilation of altimetry data into a large-scale hydrological model. As part of this previous project, Magellium implemented a hydrological forecasting system, called HYFAA (Hydrological Forecasting System with Altimetry Assimilation) combining the large-scale distributed rainfall-runoff model (namely the MGB model) and an Ensemble Kalman Filter (EnKF) which assimilates altimetry derived observations in real time. Observing System Simulation Experiments (OSSEs) were conducted to estimate the impact on MGB simulations of assimilating data from the future SWOT mission in comparison with assimilation of current altimetry data. This study was conducted on the Niger basin with SWOT observations (discharge) generated with the help of a simple simulator (Biancamaria et al., 2011). It showed that SWOT data assimilation resulted in significant improvements of the performance of the MGB model (Fig. 1) when SWOT data were correctly pre-processed before assimilation (Pedinotti et al., submitted).

Within the SWOT EA Project, we propose to perform SWOT data assimilation on the ungauged African Niger River and Congo River basins and estimate its impact on hydrological forecasting. The large volume of data to be assimilated from SWOT could lead to known limits of the EnKF, so a data selection algorithm was developed to avoid redundancy and to retain observations containing complementary information. Another challenge coming from the use of SWOT data could come from the errors associated with the products which are simplistically represented in the assimilation studies carried out so far and the assimilation of more realistic SWOT discharge products is something that needs to be investigated.
References:
Biancamaria, S., Durand, M., Andreadis, K.M., Bates, P.D., Boone, A., Mognard, N.M., Rodríguez, E., Alsdorf, D.E., Lettenmaier, D.P., Clark, E.A., 2011. Assimilation of virtual wide swath altimetry to improve Arctic river modeling. Remote Sens. Environ. 115, 373–381. https://doi.org/10.1016/j.rse.2010.09.008
Pedinotti et al.: A generic hydrological forecasting system using existing and future altimetry, under revision at the Water Resources Research Journal.
Mercator Ocean
Title: Assimilation of SWOT in the Mercator Ocean analysis and forecasting systems
Organization: Mercator Ocean
Lead: Pierre-Yves Le Traon
Summary
In routine or in real time, on a global or regional scale, both on the surface and beneath it, Mercator Ocean describes, analyses and forecasts the state of the ocean by developing the “Mercator System” for ocean analysis and forecasting and maintaining it in an operational condition. Mercator Ocean is the entrusted entity to implement the Copernicus Marine Environment Monitoring Service.
Mercator Ocean prepares the assimilation of SWOT data in the Mercator Ocean analysis and forecasting systems. It plans to combine SWOT, nadir altimeter, other satellite data (SST, Ocean Color, …) and in-situ data with high resolution global models to allow a dynamical interpolation of SWOT data and to describe and forecast the ocean state worldwide.
NASA Short-term Prediction Research and Transition (SPoRT) Center, Univ. Alabama
Title: Assimilation of SWOT WSE to Improve National Water Model Initialization and Streamflow Prediction
Organization: NASA Short-term Prediction Research and Transition (SPoRT) Center, Univ. Alabama
Leads: Nicholas Elmer (NASA SPoRT / Univ. Alabama in Huntsville); Christopher Hain (NASA SPoRT / NASA MSFC)
Summary
This project will explore the transition of NASA satellite capabilities to operational forecasters and operational models. This project will develop a methodology to assimilate SWOT water surface elevation (WSE) into the National Water Model (NWM) to expand the spatial coverage of observations to regions of the world without adequate in situ streamflow information.
In order to use SWOT data to initialize the NWM, case studies will be examined within Alaska related to rain-generated flooding events. In addition, an AirSWOT dataset collected along the Tanana River in June 2015 will be included. Synthetic SWOT WSE simulations will be generated (following Biancamaria et al., 2016), and will be assimilated into a low resolution model (WRF-Hydro).
When complete, this project will inform the user on ways to allow real-time SWOT data to be ingested into the operational National Water Model.
Current Progress and Future Steps
NOAA/CIRES University of Colorado Boulder
Title: Utilization of SWOT Data within the NOAA National Water Model
Organization: NOAA/CIRES University of Colorado Boulder
Lead: J. Toby Minear
Summary
Four potential uses of SWOT data products within the National Water Model (NWM) will be the focus for this EA activity. These include:
- Evaluating the SWOT raster data product within the Analysis mode of the NWM as an indicator of available water storage. This is a running calculation within the NWM and is not well constrained at present.
- Assessing the temporal stack of SWOT raster data products as an historical evaluation of relative level and extent of flooding for given discharges (a high priority of the NWM).
- Using SWOT river vector products (RiverSP, RiverAVG) to test current channel slope estimates in the NWM, as well as channel routing.
- Using SWOT RiverAVG vector to evaluate channel geometry estimates within NWM.
Northeastern University
Title: Integrating SWOT Data Products into Applications
Organization: Northeastern University
Leads: Edward Beighley, Professor
Summary
We currently use: (i) NASA NLDAS/GLDAS and NWS NWM output and the Hillslope River Routing (HRR) model, (ii) GRACE/GRACE-FO TWSA data, and (iii) Jason/Sentinel Altimetry data, to estimate river discharges for a suite of applications. Funding from NASA’s GRACE-FO, PMM, CARBON, and Water Resources Science Teams support the above modeling efforts. We plan to assess SWOT river discharges and surface extents using the above modeling systems.
We will develop new modeling systems the integrate SWOT data into a multisource discharge product. We also plan to assess how the temporal SWOT sampling impact our ability to derive water and carbon fluxes from large rivers.
We plan to assess SWOT data products compared to other methods. Statics on how the products differ will be determined. We will also integrate SWOT data into existing methods/models and determine improvements relative to not using SWOT data.
Ohio State University
Title: Comparing SLC and Hydrology Simulators
Organization: Ohio State University
Leads: Michael Durand, PhD, School of Earth Sciences & Byrd Polar & Climate Research Center
Summary
This project will apply the CNES Hydrology data simulator over river reaches where JPL SWOT SLC simulator has already been applied and make comparisons. Example river reaches will be from the Sacramento, Po, and Platte Rivers. Error characteristics over these rivers will be compared to understand the circumstances under which a large scale hydrology simulator such as CNES SWOT simulator is acceptable for hydrologic investigations. Comparisons will be made available over test cases for SWOT Early Adopters to understand the limit to which CNES hydrology simulator can be applied. After the launch of SWOT in 2022, the OSU team may compare SWOT simulations from the two types (JPL and CNES) actual error statistics from Cal/Val sites.
Pacific Northwest National Laboratory (PNNL)
Title: Coastal Observations, Mechanisms, and Predictions Across Systems and Scales (COMPASS-FME)
Organization: Pacific Northwest National Laboratory (PNNL)
Lead: Etienne Fluet-Chouinard
Summary
The COMPASS-FME project aims to integrate mechanistic processes of coastal environments in the earth system modeling capability of PNNL and of the Department of Energy (see figure below). A range of hydrological data on water presence, elevation and duration are used to calibrate a hierarchy of biogeochemical model along coastal gradients. Currently, a number of public and commercial optical and SAR sensors are tested at several study sites (e.g. Chesapeake Bay, Lake Erie). This coastal mapping effort could be expanded to include SWOT data early on to integrate it in the continental-to-global methodology to characterize the coastal heterogeneity. These maps of coastal environment heterogeneity will be used as input for E3SM simulations in response to extreme events and sea level rise.
As part of COMPASS-FME, data products such as surface water extent and water level height from the pixel cloud will be tested as input to calibrate and validate local biogeochemical simulations. These data will allow to expand the spatial coverage of the in-situ measurements made along gradients at across multiple sites. Early access to SWOT data will help design upcoming field campaigns and plan sampling locations to maximize alignment with SWOT data.
While COMPASS-FME is the primary research area for upcoming SWOT, other PNNL activities are prime candidates for potential SWOT integration in routine operation and capabilities:
- As part of multiple Flood hazard monitoring (Rapid Analytics for Disaster Response)
- Flood modeling for rapid emergency response (SWOT as initial conditions for RIFT)
- Sea ice monitoring near infrastructure
- Monitoring of ephemeral streams for biogeochemical modeling (similar to COMPASS-FME)
With access to SWOT Rapid Orbit data via early adopter program, the point of contact at PNNL will be able to investigate the capacity of SWOT to measure water surface height along coastal wetlands as well as water presence through sparsely vegetated coastal wetlands (even if current rapid orbit does not align with sampled sites). This includes the characterization of tidal waves along estuarine environments.

Pakistan Council of Research in Water Resources (PCRWR)
Title: SWOT applications for determining water surface area change to manage highly regulated transboundary rivers and appearing wetlands within the country
Organization: Pakistan Council of Research in Water Resources (PCRWR)
Lead: Faizan Ul Hasan (Director for Water Management and International Linkages, PCRWR)
Summary
This project will use SWOT-relevant data products to enhance the quality of flow monitoring, river flux over gates of trans-boundary reservoirs for anticipating floods in the Jhelum basin. This will allow for observation of unanticipated flood events from unregulated tributaries of river Jhelum (such as the Poonch River).
For determining the variations in wetlands, fresh simulations will be created for southern Pakistan, Sindh Province. For this aspect of study, ground data will be used for undertaking calibration/validation of the simulation. Once a simulation is created, SWOT-like products will be connected whenever available to gain monthly/cross seasonal variations in the wetlands developed on waterlogged soil.
Current Progress and Future Steps
Sofar Ocean
Title: Impacts of SWOT significant wave height assimilation on an operational, global wave forecast model
Organization: Sofar Ocean
Lead: Dr. Isabel A. Houghton
Summary
At Sofar Ocean, we have an operational wave forecasting system that produces 4- or 10-day forecasts every 6 hours. This operational forecast is then served to downstream products and external users, including a ship routing optimization platform Wayfinder. To generate wave forecasts, the spectral wave model, WW3, is implemented globally at 0.25 degree horizontal resolution. Prior to forecast initialization, we conduct hourly data assimilation utilizing a suite of observations including from the global network of Sofar Spotters (Figure 1) and satellite altimeter significant wave height (Hs) data from Jason-3, SARAL and Sentinel 6A MF. The assimilation of real time observations, both wave spectra from Spotters and bulk Hs from altimeters, yields improved wave forecast skill, particularly at the early lead times (i.e. the first 1-3 days). The data assimilation methodology is detailed in recent work published in Houghton et al. 2022.

Through the ongoing improvement of our wave forecasting system (Smit et al. 2021, Houghton et al. 2022, Houghton et al. 2023), we have found that the inclusion of additional observations improves both the accuracy of the analysis field (i.e. the output from data assimilation that serves as the initial condition) and the forecast produced by the WW3 model run. While the in situ Spotter wave buoys yield marked improvements in skill, particularly given their long dwell sampling and wave spectra information, the additional altimeter data provides complementary data in divergence zones (regions where buoys do not persist) and with high along-track spatial coverage. Consequently, additional remotely sensed data sources of Hs are valuable toward improving wave forecast skill. In this work, we aim to operationally assimilate SWOT Hs in addition to all observations already assimilated into our system.

Access to the KaRIn observations of Hs will allow Sofar to both validate and utilize the increased swath width of the instrument relative to the nadir altimeter. They will conduct a side-by-side experiment in order to directly quantify the impacts to forecast skill from the additional observations.
The Sofar Ocean forecasting ecosystem relies upon modern cloud-compute resources where experiments can be carried out in a `development` or `staging` environment that can be configured identical to the `production` environment to evaluate specific changes. Side-by-side experiments will inform development work that can be immediately transferred into `production` (our operational forecast) following conclusion of the experiments. Results from these experiments, specifically statistics of the KaRIn Hs data and impacts to the wave forecast skill will be published in a peer reviewed journal.
Stantec Consulting Services Inc. (Stantec)
Title: Application of SWOT to determine the impact of river and ocean processes on coastal dynamics, habitats, infrastructure, and communities
Organization: Stantec Consulting Services Inc. (Stantec)
Leads: Jamil Ibrahim, PH, Principal Hydrologist, Sacramento, California, USA; Francis Wiese, PhD, Marine Ecology Technical Lead, Anchorage, Alaska, USA; Grant Wiseman, Remote Sensing Center of Excellence Lead, Winnipeg, Manitoba, Canada
Summary
Stantec is engaged in a multitude of coastal resiliency, climate change vulnerability, coastal restoration, coastal engineering, and community development projects throughout the world. Planning, permitting, and executing such studies requires detailed baseline information and subsequent monitoring of environmental drivers and dynamics at sub-mesoscale both from rivers and the ocean. We will use this new SWOT high resolution data to parameterize and validate hydrographic and hydrodynamic model outputs, evaluate the effectiveness of water quality and sediment management related projects, and improve coastal hazard identification for habitats, communities, and infrastructure during planning, design, and impact assessments.
Texas Water Development Board (TWDB), Austin, TX
Title: Estimation of Volumetric Evaporative Water Loss from Unmonitored Reservoirs in Texas
Organization: Texas Water Development Board (TWDB), Austin, TX
Leads: Nelun Fernando, PhD, Manager; John Zhu, PhD, PG, Hydrologist
Summary
Of the over 7,000+ dams (lakes/reservoirs) in Texas, only 119 are gauged for water level monitoring. Evaporative loss from reservoirs is significant (especially during summer) and it often exceeds the water usage from reservoir. Being able to monitor evaporative water loss from all unmonitored reservoirs would lead to improved assessments of surface water availability in the state. The quantitative estimate of evaporative water loss requires accurate information on reservoir surface area. The volumetric water loss can be computed by multiplying the lake area with the reservoir evaporation rate that the TWDB compiles at monthly timescale for 1˚x 1˚grids. Currently, we can only estimate the evaporation loss for the monitored reservoir through reservoir specific elevation-area rating curves. SWOT’s ability to track water elevation and area/extent over global inland water bodies will equip TWDB with a monitoring capability that covers all other unmonitored water bodies that are greater than 250 m × 250 m. SWOT’s storage change data will also help TWDB with a more accurate inventory of water gained through precipitation or depleted through evaporation/water use, leading to improved forecasts of water availability.
The TWDB plans to use SWOT lake surface elevation and area datasets, along with TWDB’s gridded lake evaporation rate dataset to compute the volumetric lake evaporation loss for all lakes that are detected by SWOT on a monthly basis.


Current Progress and Future Steps
U.S. Air Force Weather's Land Information System (LIS), Offutt AFB, NE
Title: Enhancing Air Force Weather's Operational Land Information System (LIS) Using SWOT Products
Organization: NASA Land Information System (LIS) Team, Goddard Space Flight Center (GSFC), Greenbelt, MD
Leads: Jerry Wegiel (SAIC); Sujay Kumar (NASA/GSFC); Augusto Getirana (University of Maryland)
Summary
LIS (Kumar et al., 2006) is a flexible land surface modeling framework that has been developed with the goal of integrating satellite- and ground-based observational data products and advanced land surface modeling techniques to produce optimal fields of land surface states and fluxes. LIS is used in operational and routine environments at numerous U.S. agencies, supporting model runs for the North America Land Data Assimilation System (NLDAS), the Global Land Data Assimilation System (GLDAS; Rodell et al., 2004), among others. The current version of LIS includes a separate data preprocessing environment known as the Land surface Data Toolkit (LDT; Arsenault et al., 2018) and a post-processing data analytics environment known as the Land surface Verification Toolkit (LVT; Kumar et al., 2012). LDT and LVT are open source and available through GitHub.

The utility of remote-sensed data for hydrological applications is of utmost importance to the U.S. Air Force. The current lack of sufficient data-driven information available at the critical time horizons for informing transboundary water decision-making for the intelligence, defense, and foreign policy communities is a key gap in 557th Weather Wing's operational Land Information System (LIS). Implementation of a multivariate DA scheme accounting for the simultaneous assimilation of SWOT data and terrestrial water storage (TWS) anomalies derived from the Gravity Recovery and Climate Experiment (GRACE) mission into the LIS Framework will provide the much-needed observation-based constraints on modeled estimates via the USAF's LIS-based Global Hydro-Modeling Intelligence System, particularly over data poor regions of the world (Kumar et al., 2016; Getirana et al., 2014).
The resultant hydrologic products and services will be synthesized into information required by decision makers (e.g., the Interagency Water Working Group) to address transboundary water security threats including potential for migration, economic losses and conflict, and disruptions to military navigation. Thus, the proposed infrastructure will promote societal applications for sustainable water resource management, humanitarian assistance and disaster response, economic development, and regional stability.
Completion of this project and sustainment of the operational capability by Air Force Weather will empower our federal agencies and partners (e.g., Department of State) to fulfill the strategic objectives of the U.S. Global Water Strategy while helping them bring to light transboundary water issues for the stakeholder community at-large.
References
Kumar, S.V., C.D. Peters-Lidard, Y. Tian, P.R. Houser, J. Geiger, S. Olden, L. Lighty, J.L. Eastman, B. Doty, P. Dirmeyer, J. Adams, K. Mitchell, E.F. Wood, and J. Sheffield, 2006: Land Information System - An interoperable framework for high resolution land surface modeling. Environ. Modeling & Software, 21, 1402-1415, doi:10.1016/j.envsoft.2005.07.004.
US Geological Survey (USGS)
Title: USGS Satellite-based Remote Sensing of Discharge
Organization: US Geological Survey (USGS)
Leads:
- Rob Dudley (USGS Satellite-based Remote Sensing of Discharge Project Manager, New England Water Science Center)
- Jack Eggleston (USGS WMA Hydrologic Remote Sensing Branch Chief, Leetown Science Center)
- Dave Bjerklie (Hydrologist, New England Water Science Center)
- Luke Sturtevant (Physical Scientist, New England Water Science Center)
- John Jones (Research Geographer, Leetown Science Center)
- Merritt Harlan (USGS WMA Hydrologic Remote Sensing Branch, Lakewood Colorado)
Summary
The USGS has used operational monitoring of river discharge using Jason-2/3 altimetry for river stage (and slope as available) and Landsat dynamic surface-water extent for river surface geometry. These data are used with a modified flow-law equation to compute streamflow (discharge). Ancillary data include ground-based streamflow measurements collected by USGS for calibration and validation. Workflow culminates in dissemination of satellite-derived discharges via USGS National Water Information System (NWIS). We plan to use the river reach SWOT products as they become available for operational computation of streamflow at remotely sensed gaging sites. From the river reach data we will need to obtain river-reach elevation, slope, and width at locations of interest; these data are the required inputs to our existing satellite-based remote sensing of discharge workflow. We are currently developing our remote stream gauging techniques at several river reaches in Alaska. SWOT data simulated for these study reaches would be ideal for integrating into our operational stream gauging workflow. The sites have either ongoing ground-gage information or field measurements that can be used for validation. We plan to compare SWOT-derived discharge to USGS ground-based gaging station data for validation.
The USGS Water Mission Area is investing in development of the operational capability to measure river discharge from satellite data. Post launch, the ongoing R&D project expects to ingest SWOT data, when they become available, into its operational river monitoring system. We are also working with the SWOT Discharge Algorithm Working Group and plan to continue collaboration with that group to inform our stream gauging work post launch.
Current Progress and Future Steps
U.S. National Park Service
Title: Service-wide hydrologic data for ungauged rivers in National Parks
Organization: U.S. National Park Service
Leads: Christy Leonard; Susannah Erwin
Summary
The National Park Service has a service-wide need to fill data gaps in our understanding of hydrology in remote, ungauged rivers. There are many applications where SWOT data may be useful in addressing Park Service data needs, including flood inundation mapping, assessing hydrology in ungauged remote rivers, evaluating opportunities for riverine resource protection and floodplain connectivity, and assessing riverine resource vulnerability to climate change. In this project, we will determine the applicability of SWOT data to various science and management questions in the National Park Service.
The Park Service foresees an immediate application of the SWOT to estimate discharge and channel characteristics for ungauged rivers in Alaska on National Park Service land. A secondary application is to inform floodplain inundation mapping used at park to regional scales to understand the vulnerability of existing or planned infrastructure, cultural resources, and riverine ecosystems to changes in magnitude, timing, and duration of peak flows under climate change.
A significant task for the National Park Service is to evaluate the size and type of rivers where SWOT data is appropriate for our needs. For example, the service-wide need for flood hazard mapping spans rivers of various sizes, many of which are too small to be observed by SWOT. Therefore, we will evaluate conditions when SWOT data is (and is not) appropriate to inform our flood hazard mapping approach. The first step is identifying rivers and water bodies SWOT can detect within National Park boundaries. Then, we will focus on addressing specific science and management questions within those rivers and water bodies.

U.S. Navy, Naval Research Lab
Title: SWOT Ocean Prediction
Organization: U.S. Navy, Naval Research Lab
Leads: Gregg Jacobs; Joseph D’Addezio
Summary
The U.S. Navy uses sea surface height observations with numerical ocean models to predict the future ocean currents, temperatures, and salinities. The models span global coupled ocean / atmosphere / ice / wave models to nested coupled models with resolutions down to 100 m and less. The systems utilize all available satellite sea surface height, sea surface temperature, ice concentration, wave heights, and in situ profile and surface observations.
Computing ocean predictions requires correcting ocean models with recent observations. The first challenge is toprocess SWOT rapidly, removing systematic errors without damaging the ocean signal, and bringing the processed data to the ocean forecast systems. SWOT observations resolve features at much higher resolutions than prior observing systems, and many prior assumptions of data distribution and ocean features are no longer valid. We must address these prior assumptions and the manner in which observations correct the ocean forecasts changes.

University of Bonn and Helmholz-Zentrum Geesthacht
Title: Monitoring estuaries and coastal zone with SWOT
Organization: University of Bonn and Helmholz-Zentrum Geesthacht
Leads: Dr.-Ing. habil Luciana Fenoglio (University of Bonn, Institute of Geodesy and Geoinformation); Dr. Joanna Staneva (Head of Department Hydrodynamics and Data Assimilation, Institute for Coastal Research)
Summary
The proposed activity aims to investigate the new SWOT data to study the ocean processes at different scales from regional (North Sea and Baltic Sea) to coastal/estuarine/tidal inlets (German Bight, Ems, Weser, Elbe estuaries, Stanev et al., 2017, Fig. 1) and along the German coasts (Fig.2) In the 1-day phase data calibration will be attempted and the high temporal and space variability investigated over ocean and in-land water. The synergy between SWOT observations and in-situ, model simulation and SAR altimeter data (Fenoglio-Marc et al., 2015, Dinardo et al., 2017, Wiese et al., 2018) will be further used in the following science phase to improve the actual understanding of physical phenomena. The modelling tool will be based on the high spatial and temporal-resolution integrated coupled (ocean, wave, sediment transport and hydrology) model system GCOAST for river-to-ocean continuum scales (Staneva et al., 2017).
Because of its mapping resolution and of the novelty of its measurements, SWOT will present new challenges for data retrieval and interpretation, especially at the smallest length scales, which are not captured from both along-track altimetry and gridded products. Surface waves, tides, and internal waves are the physical processes which govern oceanic behavior at these small scales. For research towards application in operation we will consider the four scientific challenges listed below:
- Coastal ocean dynamics
- Coastal tides and internal tides
- Extremes
- Track coastal evolution
The approach will consist in:
- Simulating the SWOT observations
- Assessing the quality of real observations and L2 products during the cal/val 1-day phase in the limited strife covered by the 1-day repeat (Fig. 2 and river Rhine)
- Assess the quality of real observations and L2 products during the scientific phase with repeat 21 days and 2-4 observations per pass in the enlarged region (Figs. 1, 2)
- Investigate the 1-4 scientific challenges during the scientific phase in the full region (Figs. 1, 2)
Current Progress and Future Steps
References
Dinardo S., Fenoglio-Marc L., Buchhaupt C., Becker M., Scharro R., Fernandez J. Benveniste J. (2017). CryoSat-2 performance along the german coasts, AdSR special Issue CryoSat-2, https://doi.org/10.1016/j.asr.2017.12.018, https://authors.elsevier.com/c/ 1XXGm~ 6OiXQOF.
Fenoglio-Marc, L., Dinardo, S., Scharroo, R., Roland, A., Dutour, M., Lucas, B., Becker, M., Benveniste, J., Weiss, R. (2015). The German Bight: a validation of CryoSat-2 altimeter data in SAR mode, Advances in Space Research, doi: http://dx.doi.org/10.1016/j.asr.2015.02.014.
Stanev E., Schulz-Stellenfleth J., Staneva J., Grayek S., Grashorn S., Behrens A., Koch W., Pein J. (2016): Ocean forecasting for the German Bight: from regional to coastal scales, Ocean Sci., 12, 1105–1136, 2016.
Staneva J., Alari V., Breivik O, Bidlot J.-R. and Mogensen K. (2017): Effects of wave-induced forcing on a circulation model of the North Sea. Ocean Dynamics, Vol. 67, Issue 1, pp 81-191.
Wiese A., J. Staneva, J. Schultz-Stellenfleth, A. Behrens, L. Fenoglio-Marc and J.R. Bidlot (2018): Synergy between satellite observations and model simulations during extreme events. Ocean Science. doi.org/10.5194/os-2018-87.
Figures


University of Montana
Title: Evaluation of river-floodplain hydrologic and sediment connectivity in tropical rivers
Organization: University of Montana
Leads: Andrew Wilcox, Professor of Geosciences
Summary
Understanding the physical connectivity of watersheds, with respect to how water and sediment move across multiple dimensions, is important to a range of earth science and management problems, including ecosystem assessment and evaluation of dam effects. This project will investigate longitudinal and lateral connectivity of water and sediment, using data from SWOT. Our primary, initial study area is the Magdalena River Basin (MRB) in Colombia. In the MRB lateral fluxes of water and sediment between the mainstem river and floodplain lakes (ciénagas) are critical to maintaining aquatic biodiversity and associated fisheries. This hydrologic connectivity, however, may be vulnerable to hydroclimatic changes and alteration of flow regimes by upstream hydropower projects (Figure 1). We intend to use SWOT data to determine spatial and temporal variability of water levels and water surface area of the mainstem Magdalena River and its ciénagas and, when SWOT discharge products are available, how discharge variability influences lateral connectivity. Validated data on surface water levels along the floodplain of the middle Magdalena River and in the Mompos Depression (Figure 1) will be used to measure directionality and magnitude of flows between the mainstem river and floodplain lakes, storage changes, and sensitivity of hydrologic connectivity to climate, alteration of flow regimes by upstream dams, and other factors. We will also compare SWOT-based results to Landsat-based measurements of surface-water extent and in-situ (gaging station) flow and sediment transport data along the Magdalena River. Insights into water levels and discharge provided by SWOT data will also be used to better understand fluvial sediment regimes in the MRB, including lateral transport of sediment between the river and its ciénagas. We anticipate using SWOT products to expand our analysis of water and sediment connectivity to other tropical river systems, including rivers in the northern Andes with attributes similar to the Magdalena.

vorteX.io
Title: Smart and innovative light remote sensing solutions dedicated to in-situ Calibration/Validation activities of the SWOT space mission over hydrological areas
Organization: vorteX.io
Leads: Guillaume Valladeau (CEO), Jean-Christophe Poisson (CTO)
Summary
The new capabilities and performance offered by the SWOT mission demonstrate the need to progress and innovate in science, but also to lead the specific methodological developments (new methods of treatment, adaptation existing methods, ...), in close collaboration with scientists and end users. Integrated into complex information systems, data provided by the SWOT mission will maintain and improve the quality of ocean forecasts and hydrological diagnostics whose economic value is recognized. These analyzes will only be possible if the quality of the SWOT measurements is demonstrated. This mission therefore requires the development of accurate Calibration and Validation tools adapted to the very high precision of the expected measurements.
Concerning the routine monitoring of inland water bodies, the vorteX.io light altimeter is a complementary space-derived remote sensing solution for bridging data gaps and comparing data time series with other instruments. Indeed, this solution relies on the complementarity between flying UAVs and an autonomous light altimeter payload with a centimeter accuracy water surface height assessment over rivers and lakes. Taking the advantage of UAV versatility and fast deployment capabilities, the solution is based on an innovative instrument capable of performing high resolution and real-time measurements of hydrological areas. Thus, on-demand fast data acquisition is possible, as well as offline long-term monitoring.
We propose the vorteX.io solution to be considered by the SWOT mission team and early adopters to perform in-situ measurements campaigns over hydrological systems and provide relevant information collocated in space and time with the SWOT mission in order to assess its performance over hydrology.
Water in Sight
Title: Validating & enhancing conjunctive access to observation data from manual hydrological in-situ measurements and the SWOT mission
Organization: Water in Sight Ltd
Leads: Louise Croneborg-Jones, Dr Guy Schumann
Summary
Swedish startup, Water in Sight Ltd has developed an SMS and WhatsApp service for hydrological gauge readers in least developed countries (LDCs) to send their manual observation measurements of river and rainfall levels to an online database for free – to harness scalable observations addressing the 70% gap of observation data. Operational hydrologists in government can access raw and quality-controlled data, capture subjective observations of flood thresholds and manage equipment inventory. The solution has been scaled to approximately 80 river and rainfall monitoring stations across Malawi, providing twice daily observations. In April 2023, a pilot for 15 synoptic stations kicked off in Mozambique and next, further validation will be done at river monitoring stations in Sierra Leone with their National Water Resources Management Agency.

Factors including lack of calibration, damage to gauge plates, and fraudulent data entry have made manual observation measurements prone to data quality challenges, therefore ancillary data is needed to improve data quality control and tools. In the Early Adopter project, Water in Sight will assess how SWOT products could be integrated into routine operations, analyze the application potential of using SWOT observations for monitoring 50m+ rivers alongside manual observations, and explore how SWOT observations can be made available, alongside other data sources - in a user-friendly data dashboard.
Video: https://youtu.be/tqeQOdHDYlk
